10 Meter Clutter Data
What is it and why does it matter?
Regulatory Solutions Inc.
Clutter Data: What It Is and Why It’s Important
- A mapping layer of “land use/land cover” data is overlaid on terrain data to provide a detailed view of what’s truly out there.
- Often referred to as tree data, it includes much more than just trees.
- Each pixel represents a clutter category, with an assigned elevation that creates a three-dimensional perspective.
- Depending on the resolution of the data, only one clutter classification is displayed per pixel at a time.
Basic terrain view for Albany NY

The same area with a map overlay

Clutter Data: Understanding Resolution and Its Impact
- The resolution of clutter is determined by the size of the pixel or “bin” used in the overlay on terrain.
- The most commonly used data resolution is 30 meters, meaning each pixel/bin represents a square measuring 30 meters on each side, which can be overlaid on a map.
- Each bin is classified based on the category that occupies the majority of its space, even if multiple categories exist within it (e.g., buildings, trees, cropland).
- For example, a house within a grove of thick trees would be classified as trees, even though a building is present.
That same Albany map with 30 meter clutter data overlaid.

That same Albany map with 30 meter clutter data overlaid.

Even though this is a flat map view, this data has a height value as well.
- The resolution of clutter is based on the size of the pixel or “bin” of the data used for the overlay on terrain.
- The most commonly used data is typically 30 meters, meaning the pixel/bin for that clutter is a square measured 30 meter on a side which can be overlaid on a map.
- That bin gets classified with the category that takes up the majority of space within the bin even there is more that one category within (buildings, trees, cropland, etc.). An example might be a house within a grove of thick trees that would only get classified as trees even though there is a building there.
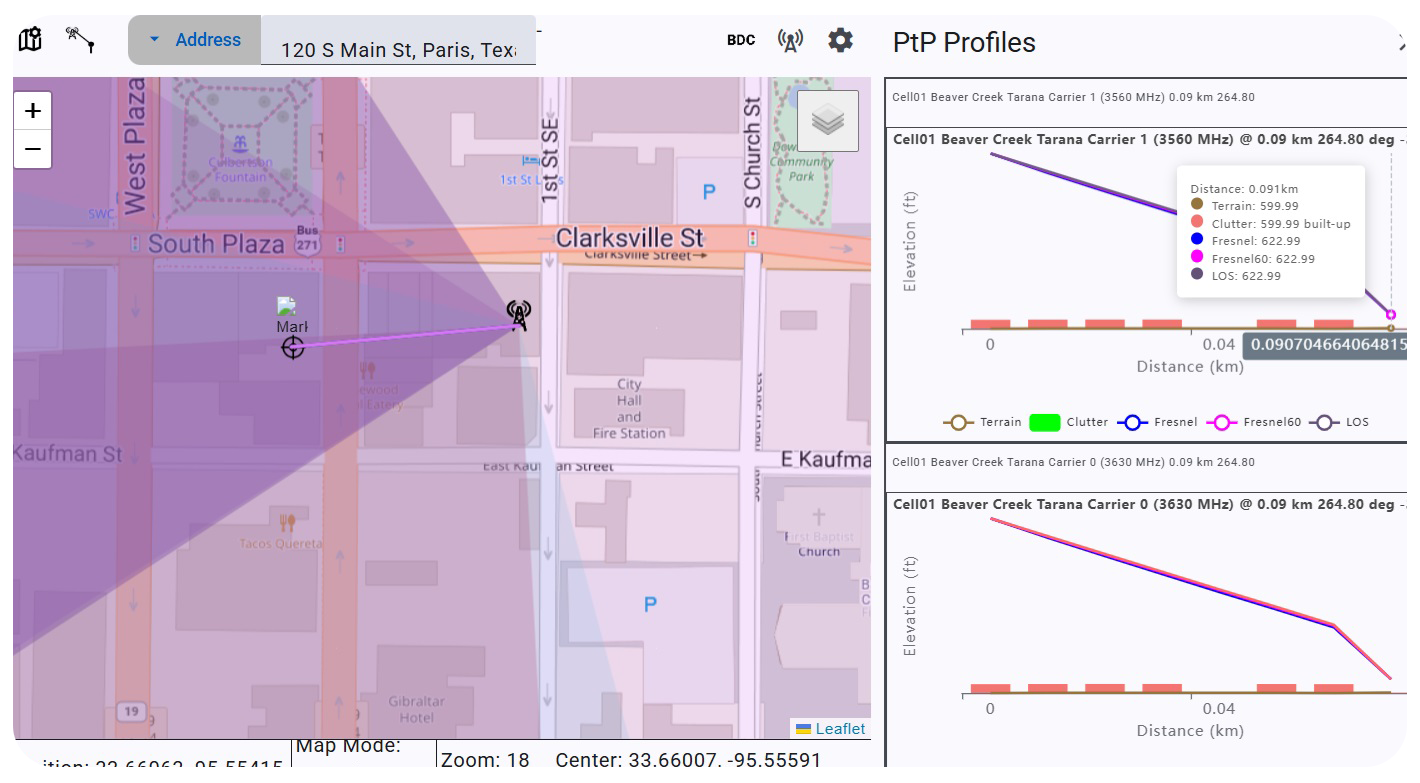
A cross section or path profile shows the terrain and clutter together.

Clutter Data: Why It Doesn’t Tell the Whole Story
- A 30-meter resolution covers a relatively large area and can contain multiple categories, but only the dominant category in that bin is displayed (e.g., the house in the trees).
- Increasing the clutter resolution to 10 meters per square allows for more categories to be displayed over the same area—nine times more, in fact.
- With this higher resolution, that house may now appear in the data.
- Similarly, a single stand of trees in the front yard of an otherwise clear lot may also be represented.
Another side by side Comparison
30m Clutter in Sherman, TX

10m Clutter in Sherman, TX

Profiles provide a clearer view, allowing for accurate calculations of losses from trees and other obstructions to determine if a location is serviceable.